

Free Diagrams Tool Top 3

We all use diagrams at least once in our work. Diagrams are a very useful tool for visually sharing information with others, and as they are used in a wide variety of fields such as presentations, reports, class materials, learning materials, computer engineering, etc., diagrams have now become essential for anyone who works on a computer. Let’s take a look and learn about tools that are available for free.
What is a diagram?
A diagram is a tool that expresses information visually. There are many different types of diagrams, each
Diagrams are powerful tools for visualizing information. There are many different types of diagrams, each with their own purpose and benefits.
Diagram Type:
Information Diagram: Used to communicate information effectively and organize it in an easy to understand manner.
Pie Chart: Used to visualize ratios and components.
Bar graph: Used to compare values.
Line Graph: Used to track changes over time.
Flowchart: Used to describe the steps of a process or system.
Concept Diagram: Used to visualize abstract concepts and relationships.
Mind Map: Used for brainstorming and organizing ideas.
Concept Map: Used to express relationships between concepts.
Structure diagram: Used to visualize the structure of a system or component.
ERD (Entity Relationship Diagram): Used to express the structure of the database.
UML (Unified Modeling Language): Used to express the design of software systems.
Free Diagram Tools, Top 3
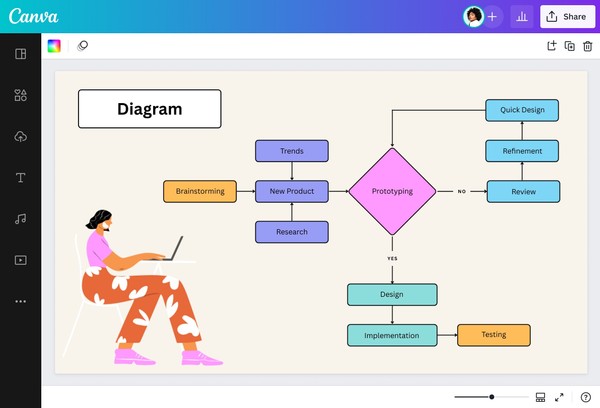
1. Canva
Canva is an online tool that makes it easy to handle a variety of design tasks, and also provides excellent features for creating diagrams. It provides templates, shapes, and icons to create professional-level diagrams, and has the advantage that anyone can easily use it without any coding experience.
Canva lets you create different types of diagrams:
Informational diagrams: Pie charts, bar graphs, line graphs, flow charts, etc.
Concept diagram: Mind map, concept map, etc.
Structure diagram: ERD (Entity Relationship Diagram), UML (Unified Modeling Language), etc.
Advantages of creating Canva diagrams:
Convenient: Online-based and available anywhere
Diversity: Provides abundant templates, shapes, and icons
Simple: Easy to create using drag and drop method
Customization: High design freedom with various themes, fonts, and colors
Collaboration: Collaborate with team members
Free: Basic features provided free of charge
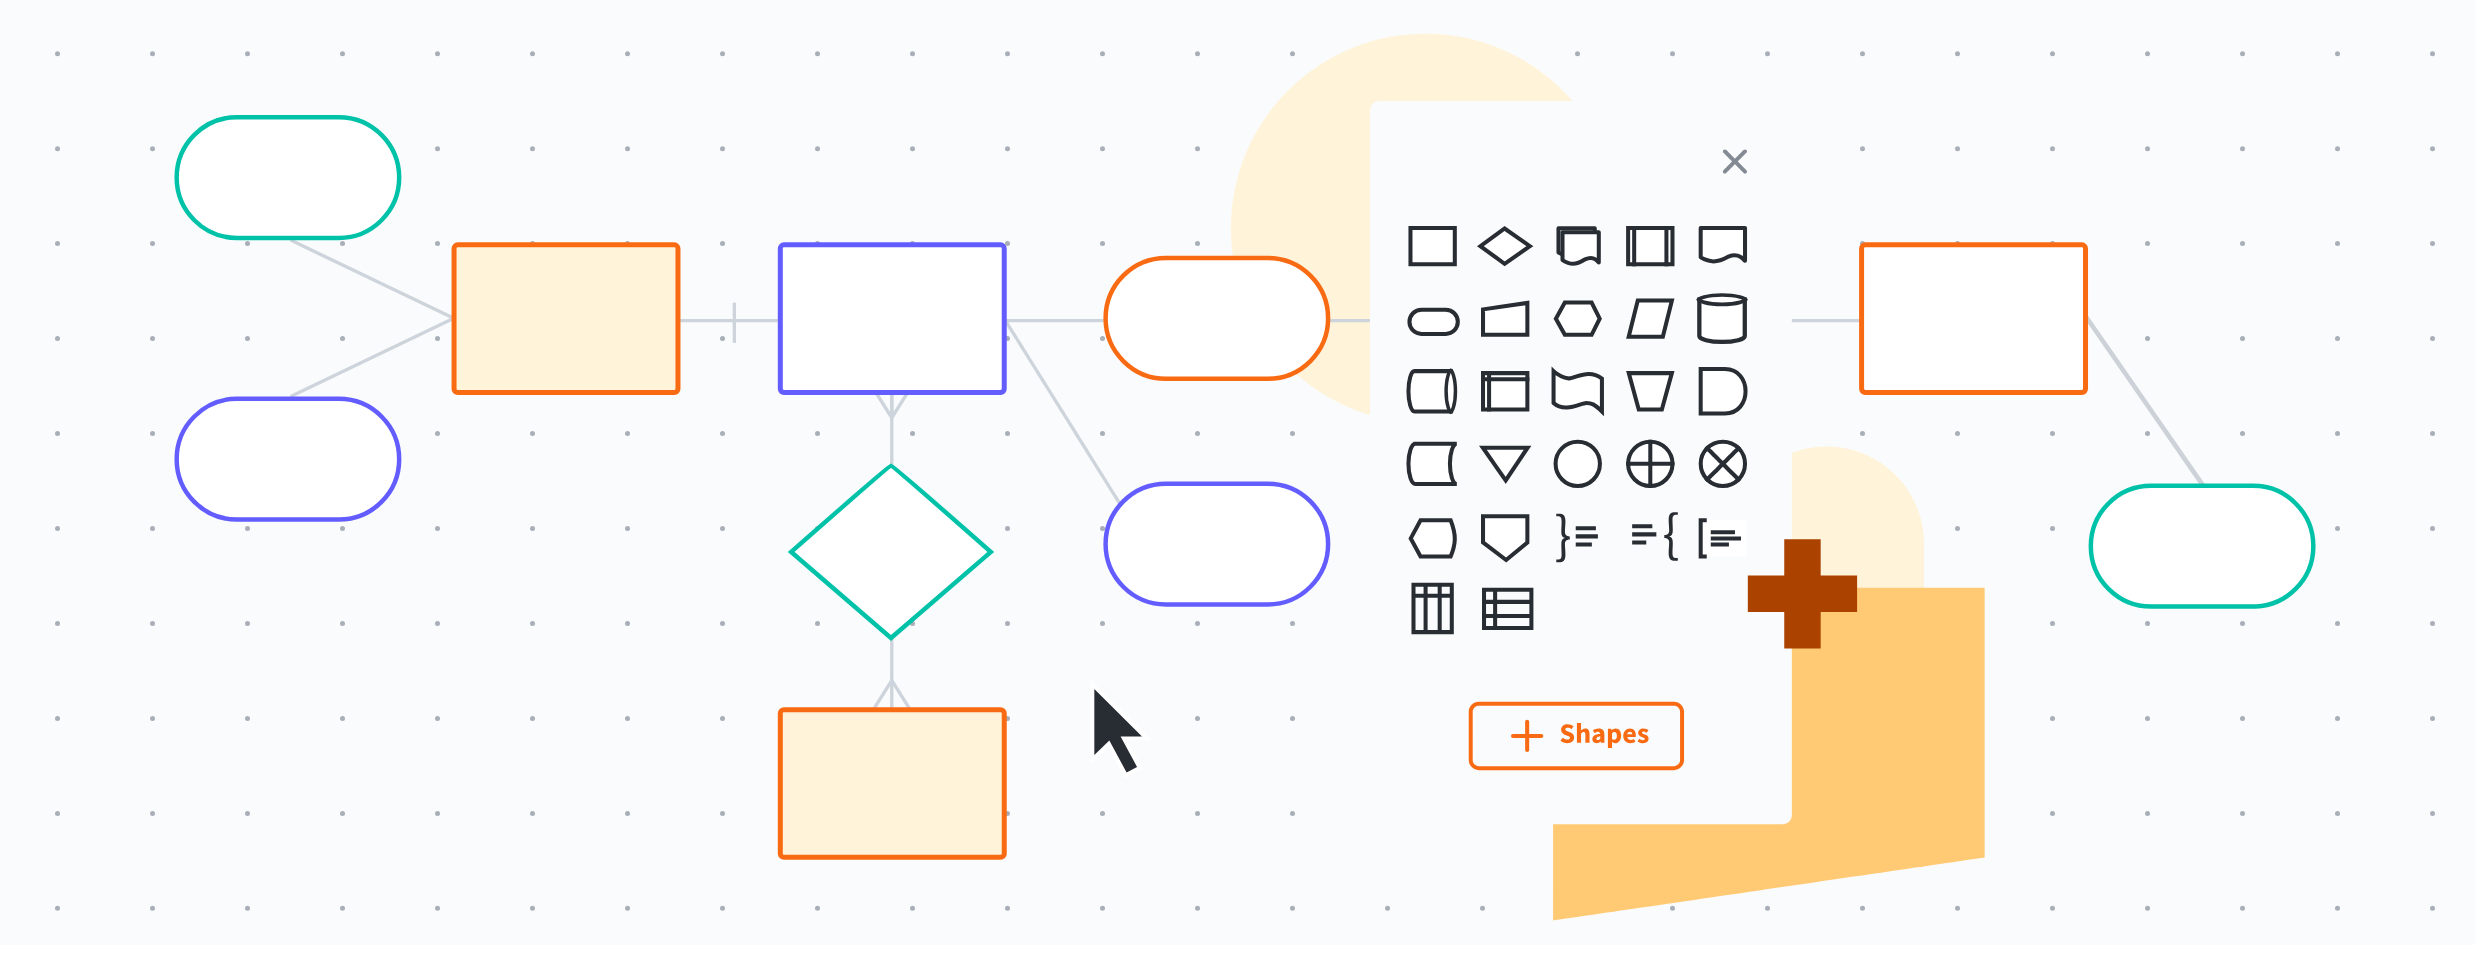
2. Draw.io
Draw.io is an online tool that allows you to create various types of diagrams for free. It can be used directly in a web browser without installation, and provides rich functions and an intuitive interface so anyone can easily create diagrams.
Draw.io allows you to create different types of diagrams:
Informational diagrams: Pie charts, bar graphs, line graphs, flow charts, etc.
Concept diagram: Mind map, concept map, etc.
Structure diagram: ERD (Entity Relationship Diagram), UML (Unified Modeling Language), etc.
Network diagram: Network configuration diagram, topology, etc.
Other: Wireframes, electrical schematics, family tree diagrams, etc.
Key features of Draw.io:
Free: Basic features provided free of charge
No installation required: Can be used directly in your web browser
Various features: Rich shapes, templates, and icons provided
Intuitive interface: Easy to create using drag and drop method
Supports various file formats: PNG, JPEG, SVG, PDF, etc.
Cloud storage: Can be linked to Google Drive, Dropbox, etc.
Collaboration: Collaborate with team members in real time
3. Lucid Chart
LucidChart is a powerful online tool that allows you to create various types of diagrams. It provides professional-level functionality and can be used in a variety of fields, including business, education, and science.
Lucid Chart allows you to create diagrams like the following:
Informational diagrams: Pie charts, bar graphs, line graphs, flow charts, etc.
Concept diagram: Mind map, concept map, etc.
Structure diagram: ERD (Entity Relationship Diagram), UML (Unified Modeling Language), etc.
Network diagram: Network configuration diagram, topology, etc.
Other: Wireframes, electrical schematics, family tree, etc.
Main features of Lucid Chart:
Powerful features: Provides rich shapes, templates, and icons
Intuitive interface: Easy to create using drag and drop method
Supports various file formats: PNG, JPEG, SVG, PDF, etc.
Cloud storage: Can be linked to Google Drive, Dropbox, etc.
Collaboration: Collaborate with team members in real time
Data Connection: Real-time data can be connected to diagrams
Customization: Freely change themes, fonts, colors, etc.
4. Comparison
Comparison of Canva vs Draw.io vs Lucidchart
Features | Canva | Draw.io | Lucidchart |
|---|---|---|---|
price | Free, Paid (Pro) | Free, paid | Free, paid |
Basic features | Pie charts, bar graphs, line graphs, flow charts, mind maps | Various shapes, templates, icons | Various shapes, templates, icons, data connections |
Advanced Features | Image editing, design tools | Network diagram, wireframe | Custom themes, fonts, colors |
data connection | X | X | O |
Custom | LIMITED | LIMITED | O |
interface | Intuitive, simple | Intuitive | Intuitive |
Drag and drop | O | O | O |
template | abundance | Variety | Variety |
Real-time collaboration | X | O | O |
Comments | X | O | O |
Version Control | X | X | O |
Korean language support | O | O | O |
Tutorial | O | O | O |
Community | O | O | O |
Share
Tag